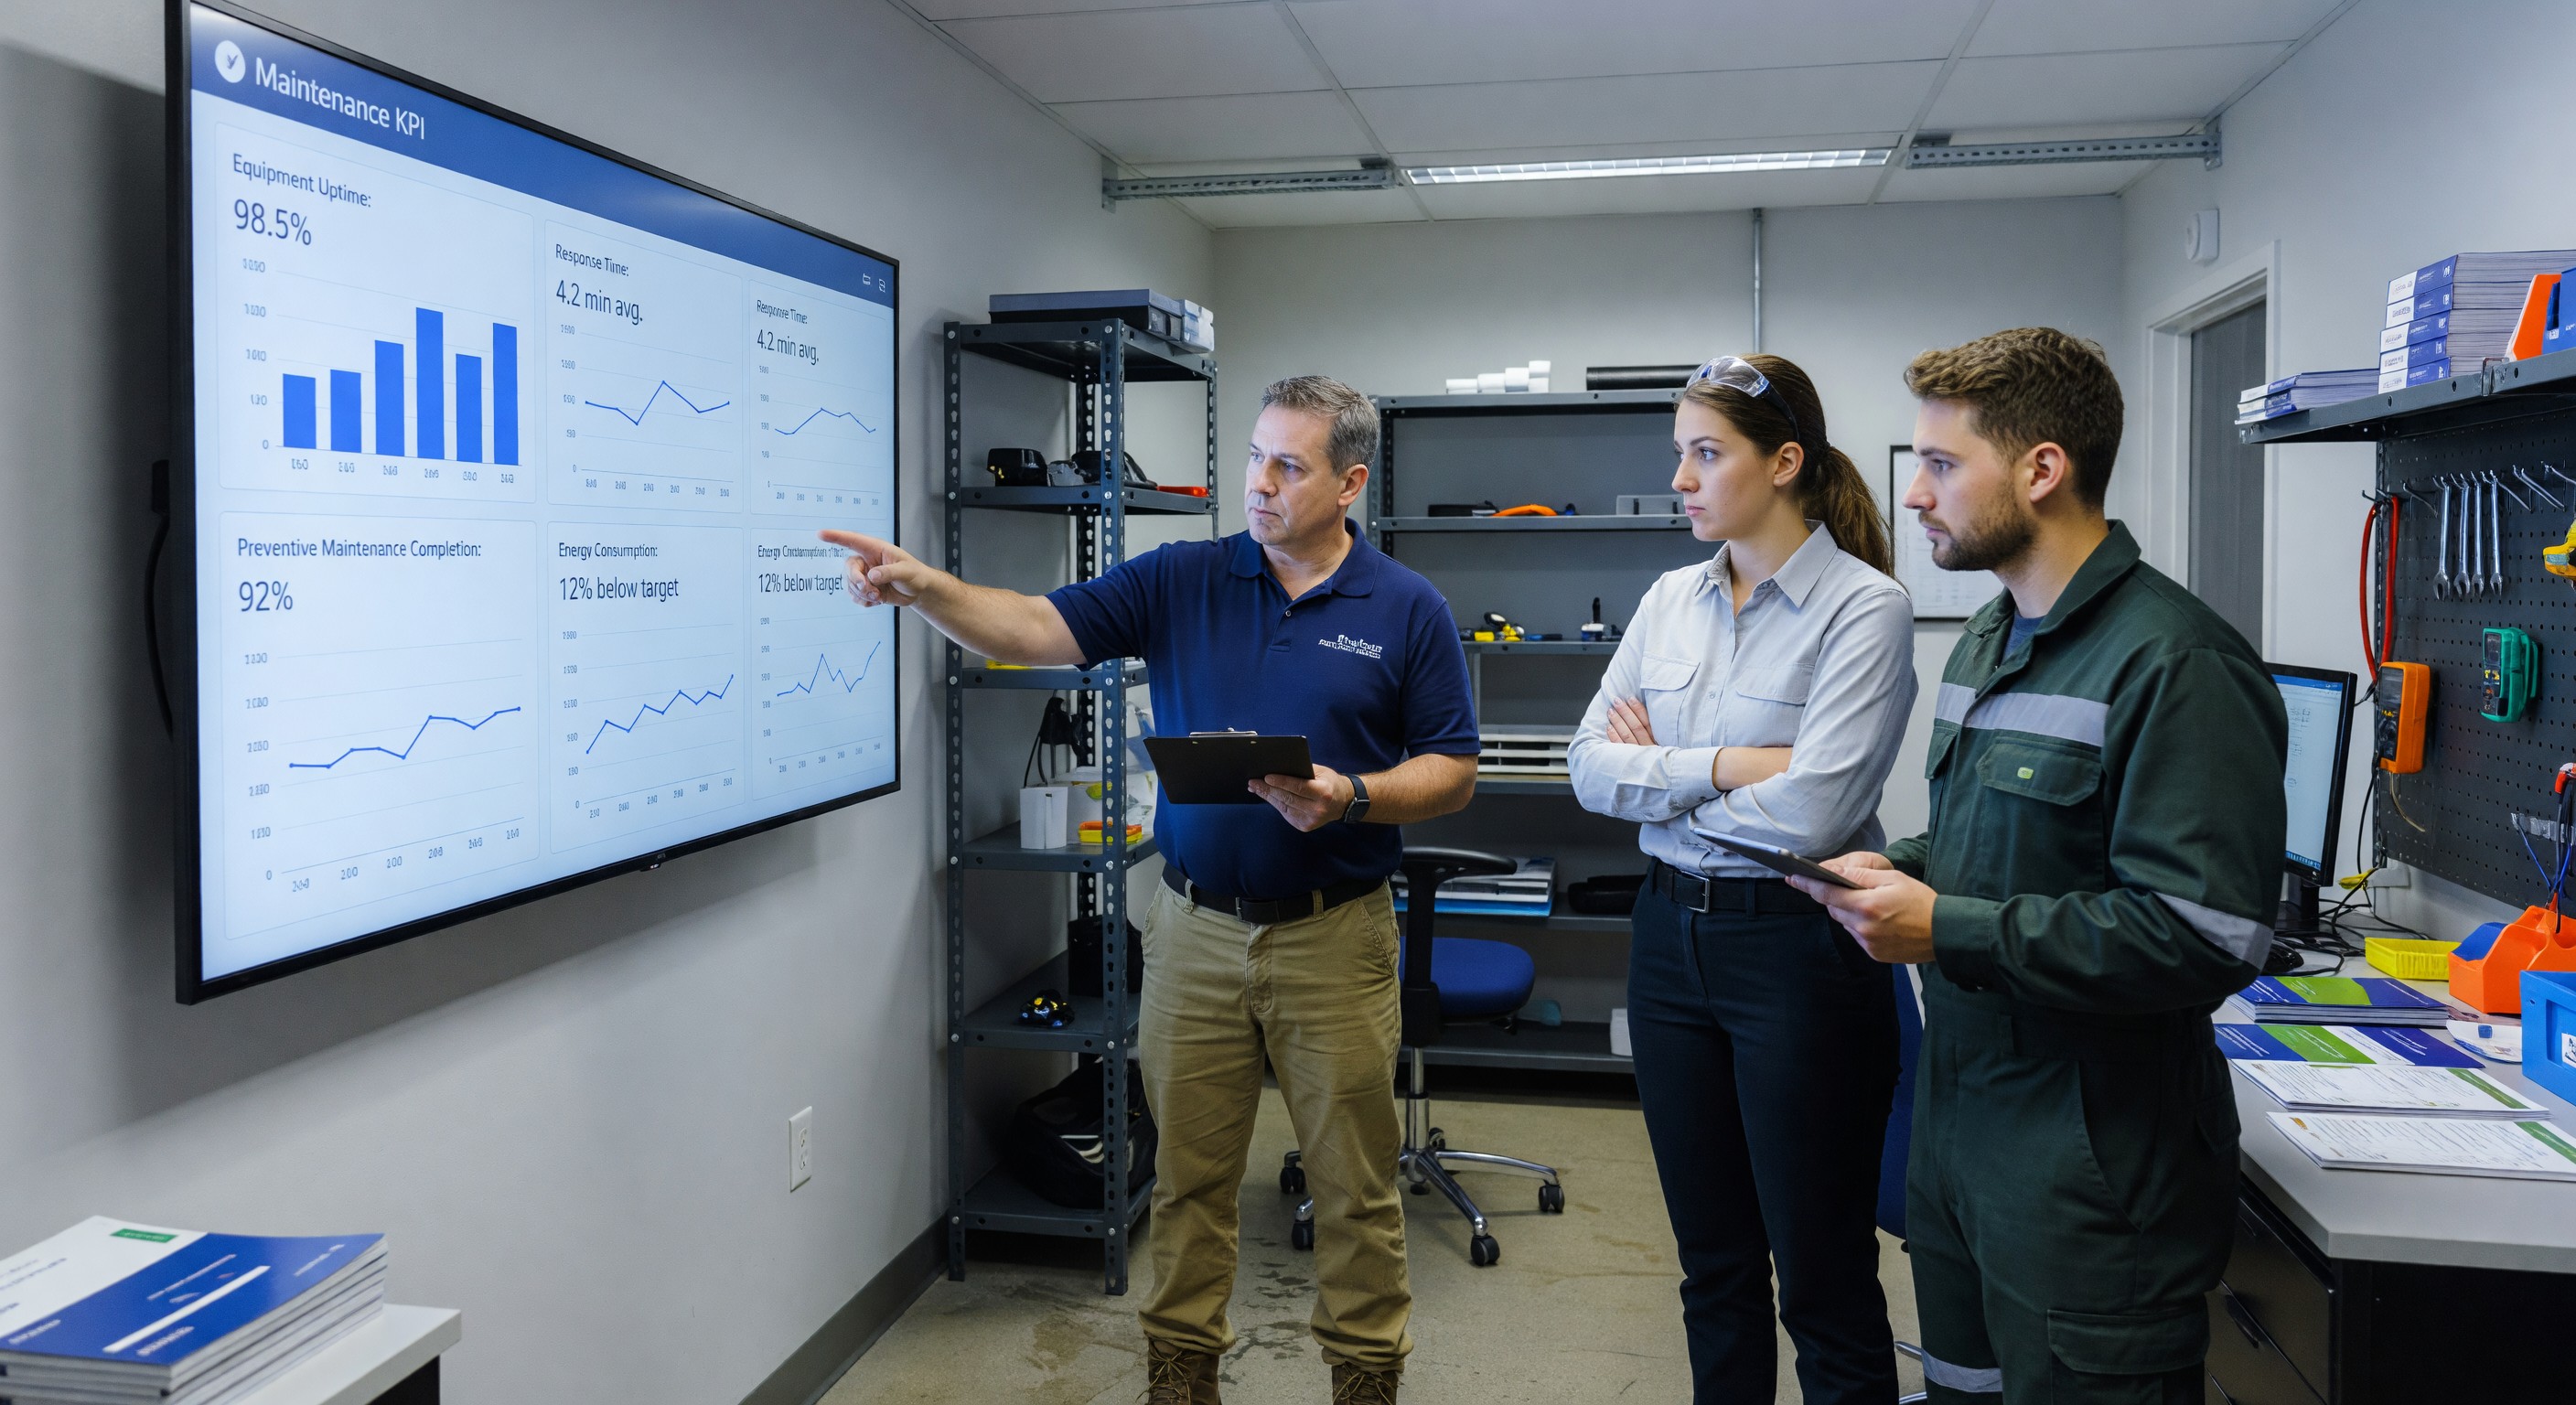
What gets measured gets managed — the cliché is accurate in hotel engineering. Engineering departments that track meaningful performance metrics make better decisions about staffing, preventive maintenance investment, and capital planning than those operating by feel and institutional knowledge alone.
Building an effective hotel maintenance KPI dashboard requires selecting metrics that are measurable with available data, meaningful for engineering management decisions, and actionable — metrics that engineering staff can influence through their choices and behaviors.
Tier 1: Operational Effectiveness Metrics
These metrics measure whether the maintenance program is functioning as designed:
Preventive Maintenance Completion Rate
Definition: Percentage of scheduled PM work orders completed within the defined compliance window (typically within ±7 days of the scheduled date).
Target: 90%+
How to track: CMMS report on PM work orders scheduled vs. completed in each period. Most CMMS platforms generate this report automatically.
Why it matters: Low PM completion rates indicate that the department is too reactive — chasing breakdowns rather than executing planned maintenance. A department completing less than 75% of scheduled PMs will eventually experience equipment failure rates that further erode PM completion, creating a self-reinforcing downward cycle.
Reactive Maintenance Ratio
Definition: Number (or labor hours) of reactive/corrective work orders as a percentage of total work orders.
Target: Less than 25% reactive (75%+ of work hours on planned work)
How to track: CMMS classification of work orders by type (PM vs. corrective). Most CMMS require work order type classification at creation.
Why it matters: High reactive ratios indicate the department is operating in “firefighting” mode — responding to failures rather than preventing them. World-class maintenance organizations operate at 10–15% reactive; average is 30–40%; poor programs are 60%+ reactive.
Mean Time to Repair (MTTR)
Definition: Average time from work order creation (or equipment failure report) to work order completion (equipment restored to service).
Target: Varies by equipment category. Guest-facing failures (HVAC, TV, hot water): less than 2 hours. Non-guest-facing: less than 8 hours standard, 24 hours acceptable.
How to track: CMMS time stamps on work order creation and completion, average by equipment category.
Why it matters: MTTR directly affects guest satisfaction. A guest who reports no hot water expects resolution within an hour; a 4-hour MTTR for this complaint will generate a negative review.
Tier 2: Equipment and Asset Metrics
These metrics assess the health of the equipment fleet:
Equipment Availability Rate
Definition: Percentage of time that critical equipment (elevators, boilers, chillers, domestic hot water systems) is available and operational vs. total available time.
Target: 99%+ for elevators and hot water; 98%+ for HVAC systems.
How to track: Equipment downtime logs (when did the equipment go down, when was it restored). BAS systems may provide automated downtime tracking for HVAC equipment.
Why it matters: Cumulative downtime for critical systems, even in short episodes, creates significant guest impact. A single elevator that averages 3 hours of downtime per month has 98.7% availability — but if that 3 hours concentrates on a Saturday morning at peak checkout, the guest impact is disproportionate.
Work Order Backlog Age
Definition: Number of open corrective work orders more than 30 days old.
Target: Less than 10% of open work orders older than 30 days.
How to track: CMMS report on open work order age distribution.
Why it matters: An aging backlog indicates that the department is creating work orders faster than they’re closing them — either from understaffing, excessive PM commitments, or poor work prioritization. Old open work orders for guest-facing items are a guest satisfaction and liability risk.
Repeat Failure Rate
Definition: Percentage of equipment that requires the same repair within 90 days.
Target: Less than 5% of corrective work orders are repeats.
How to track: CMMS search for equipment with multiple corrective work orders of the same type within 90 days.
Why it matters: Repeat failures indicate that the root cause of a problem wasn’t addressed during the initial repair. A PTAC unit repaired for “not cooling” three times in 90 days has an underlying problem — refrigerant issue, coil condition, fan failure — that surface repairs aren’t resolving. Repeat failures waste labor and maintain ongoing guest complaint exposure.
Tier 3: Financial and Efficiency Metrics
Maintenance Cost per Occupied Room
Definition: Total maintenance department cost (labor, materials, contracted services) divided by total occupied room nights.
Benchmarks: Limited-service hotels: $8–$15 per occupied room night. Full-service hotels: $15–$30 per occupied room night. Resort properties: $25–$50 per occupied room night.
How to track: Monthly GL actuals from maintenance department accounts divided by RevPAR-driven occupied room night count from the PMS.
Why it matters: Benchmarking against peer properties identifies whether maintenance costs are in line with the property tier and age. Significant deviations from benchmarks — either high or low — warrant investigation.
Emergency Maintenance Cost Ratio
Definition: Emergency/after-hours maintenance cost (overtime premium, emergency contractor call-outs) as a percentage of total maintenance cost.
Target: Less than 10%.
How to track: Track overtime hours separately from regular hours in timekeeping; track emergency contractor call-out costs separately from scheduled contractor costs.
Why it matters: Emergency maintenance costs 2–3× planned maintenance for the same work. A high emergency maintenance cost ratio is a leading indicator of inadequate PM — equipment that fails in emergency situations wasn’t maintained adequately to prevent failure.
Building the Dashboard
Data sources: KPI dashboards can be built from CMMS reports (PM completion, MTTR, repeat failures), timekeeping system reports (labor hours by work type), accounting system reports (cost), and PMS reports (occupied room nights). Most CMMS platforms offer built-in dashboard capabilities that can display these metrics graphically.
Reporting cadence: Monthly reporting with quarterly trend review. Weekly review of operational metrics (open work order backlog, outstanding guest room failures) allows faster operational response.
Audience-calibrated reporting: Engineering team dashboards should show detailed operational metrics. GM/owner reporting should summarize performance against targets with context — not a raw data dump. Present what the metrics mean and what actions are being taken to address gaps.
Frequently Asked Questions
What CMMS platforms provide the best built-in KPI reporting for hotels? CMMS platforms with strong hotel hospitality reporting include: Quore (purpose-built for hotels, with guest satisfaction integration), Transcendent (hotel-focused with strong analytics), Alice/Actabl Operations (hotel operations platform with maintenance module), and general facilities CMMS platforms like Maintenance Connection and eMaint that are widely used in hospitality. The best platform depends on property size and existing technology ecosystem — any platform will provide KPI data if work orders are consistently created and closed with accurate time stamps and classification.
How do you benchmark hotel maintenance KPIs against industry standards? Industry benchmarks for hotel maintenance are available from several sources: Smith Travel Research (STR) includes some maintenance cost benchmarks in its STAR reports; the Cornell Hotel Sustainability Benchmarking Index provides energy and operational benchmarks; the Hospitality Asset Managers Association (HAMA) publishes periodic benchmarking data. Peer benchmarking through management company reporting (if the hotel is part of a managed portfolio) is often the most useful comparison, as it accounts for property type and tier.
Can maintenance KPIs be tracked without a CMMS? With significant manual effort, yes — but the data quality degrades rapidly without systematic capture. Preventive maintenance completion can be tracked on a spreadsheet; MTTR requires logging failure and completion times manually; repeat failures require cross-referencing paper work orders. For properties too small to justify CMMS investment, basic KPI tracking in a shared spreadsheet maintained by the chief engineer provides more value than no tracking. For properties above 75–100 rooms, a dedicated CMMS is cost-justified by the data quality improvement alone.
How should engineering departments use KPI data during annual reviews? Engineering KPI trends are powerful evidence in department budget conversations. PM completion rate trending up demonstrates that the PM program investment is being executed as funded. Emergency maintenance cost declining demonstrates that PM investment is reducing reactive costs. Equipment availability improving demonstrates capital maintenance investment impact. Present KPI data with trend lines, not just point-in-time values — trend improvement or decline tells a story that single numbers don’t.
Further Reading from Authoritative Sources
- IFMA maintenance KPI standards and engineering performance benchmarks — IFMA provides facility management professionals with maintenance performance benchmarking frameworks, KPI standards, and engineering department measurement methodologies applicable to hotel maintenance dashboard design and program evaluation.
- AHLA hotel engineering performance and operational standards — AHLA provides hospitality industry benchmarking data on engineering performance, maintenance cost standards, and operational KPI frameworks applicable to hotel engineering department measurement and management reporting.